What Goals Can IRCLogParser Accomplish?
IRCLogParser aims to cover some of the most prevalent issues and topics in social networking. It can be used to track the community of experts on channels, form different types of graphs for making predictive models, track the nickname changes of users, assign weights based on the activeness or response times for each user amongst various other activities.
Evolution of a channel through Time lapse
We use the dynamic graphs feature obtained from Gephi (https://gephi.org/). Gephi can read various different graph formats like CSV, Spreadsheet, GraphML, GDF, GML, Pajek etc. We input graph information using the Spreadsheet format into Gephi. The Spreadsheet must contain both node and edge characteristics which is written using a python program.For nodes the columns are ID, Label, Date start, Date end. For edges the columns are From, To, Date start, Date end. The start and end times are in datetime format and can be merged together to create the time interval for our time lapse. The nodes are fixed for a particular time interval, e.g a month and are organised in a circular layout. The edges appear when a message is sent in the IRC channel, parsed using the IRC log files. The edges that appear on a particular day stay till the end of the day.
Time lapse [29-March-2013 04:06:00]:
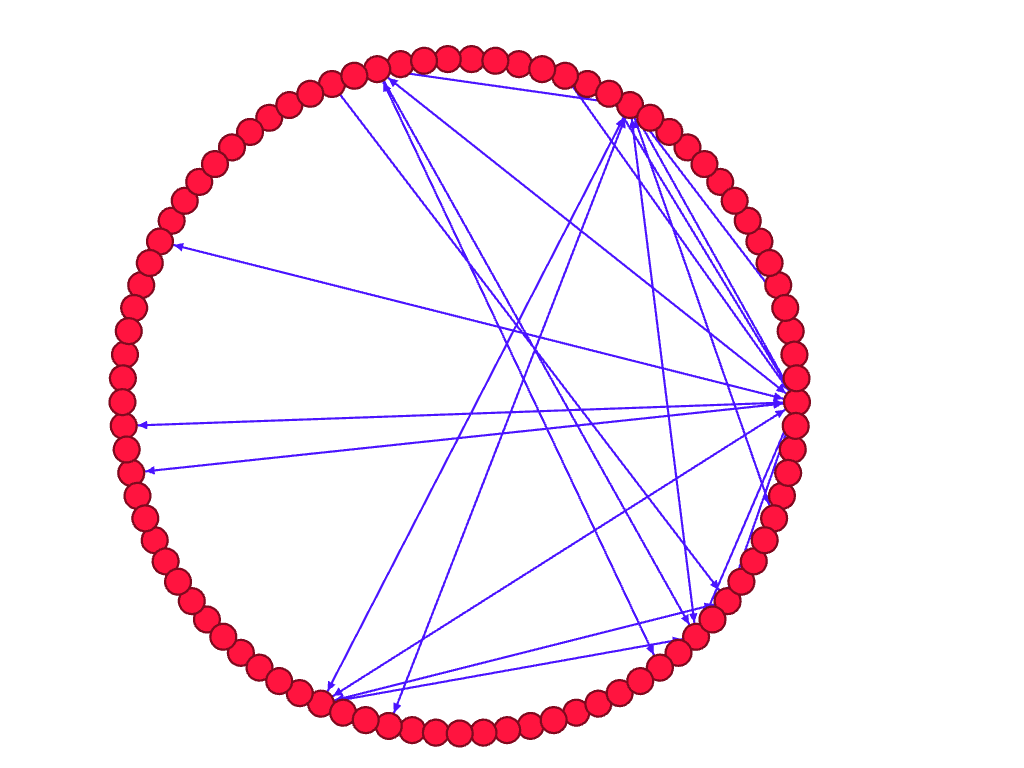
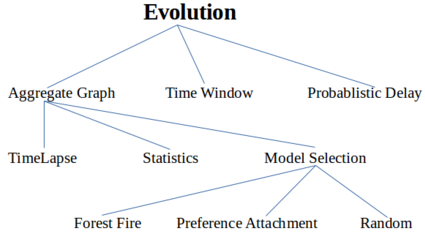
The evolution techniques for analyzing the IRC social networks are depicted in the figure below. Out of these, we utilize the time lapse for aggregate graph as mentioned above.
Interest of a user
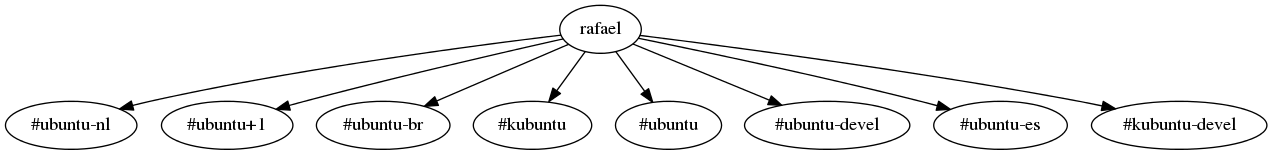
IRCLogParser has the ability to parse log files of various channels in a directory structure and map a user with the channels he was present on. This helps us in identifying the interest base of users and further predicting their availability on particular channels. It can also give us information about the probability of a user being on certain channels over other ones.
User named Rafael was on these 8 channels for the Month of January, 2013.
Community Structure
In the study of complex networks, a network is said to have community structure if the nodes of the network can be easily grouped into sets of nodes such that each set of nodes is densely connected internally. This implies that the network divides naturally into groups of nodes with dense connections internally and sparser connections between groups. The more general definition is based on the principle that pairs of nodes are more likely to be connected if they are both members of the same community(ies), and less likely to be connected if they do not share communities.
We deduce the community structure for IRC channel communications using the Infomaps community detection algorithm. (http://www.mapequation.org/code.html)
Infomap optimizes the map equation, which exploits the information-theoretic duality between the problem of compressing data, and the problem of detecting and extracting significant patterns or structures within those data. Specifically, the map equation is a flow-based method and operates on dynamics on the network. The hierarchical map equation measures the per-step average code length necessary to describe a random walker’s movements on a network, given a hierarchical network partition.
Infomaps takes pajek format (http://www.mapequation.org/code.html#Pajek-format) files as input and outputs a .tree file (http://www.mapequation.org/code.html#Tree-format) for analysis. The pajek files are produced using a python program which reads the IRC log files and uses python-igraph’s write_pajek function to do the required. The resulting hierarchy corresponds to the best hierarchical partition (shortest description length) of the attempts.
Statistical (Activity) graphs of users and channels
The statistical information for users are their indegree and outdegree. This characteristic gives excellent information about the contribution of a user on a channel. For e.g a user with a constantly high indegree on a ubuntu doubt solving channel can be one with a good level of expertise who gets a lot of questions for newbies, on the other hand one with a high outdegree can be a user with a lot of doubts to be solved. The change in a users degree distribution over time can give us important information about his behaviour specifically his interest and channel contribution. Also, we can observe some users with initially a higher outdegree to later have a higher indegree over a year span which demonstrates the increase in proficiency of that user from a beginner to a expert.
Statistics for the users is different from the ones involved for analyzing a channel behaviour. These include-
- HeatMap, mentioned above.
- Response time(RT) - This refers to the response time of a message i.e. the best guess for the time at which one can expect a reply for his/her message.
- Conversation Length(CL) - The length of time for which two users communicate i.e. if a message is not replied to within RT, then it is considered as a part of another conversation.
- Conversation Refresh time(CRT) - For a pair of users, this refers to the time when one conversation ends and another one starts.
- Multidimensional Analysis of (1) to (5) We extend our aforementioned analysis to all the ubuntu channels for 2009-2014.